We show the calculation on a live funnel — before you grant access to your own
The demo is the same widget that installs into amoCRM, only the data is not yours: an anonymised property developer account, the “Продажи новым клиентам” pipeline, July 2026. It opens from a link.
What you will see
Below is what the stock report does not show. Everything runs off one slice: switching tabs resets nothing.
Conversion between adjacent stages
A step is counted from the previous one, not from the pipeline entry. You see exactly where the sale breaks.
Parking stages out of the calculation
Where a deal waits for a call, a decision or the season — a separate list with its own numbers. Waiting stops looking like a loss.
Rollbacks and exits to other pipelines
In July 2026 — 408 rollbacks and 686 transitions into another pipeline. A single-pipeline report does not show this work at all.
A refusal to count when data is thin
Fewer than 8 deals in the base — “not enough data” instead of a percentage. A percentage off a couple of deals is a coincidence, not a metric.
anonymised property developer account · pipeline 3423622 “Продажи новым клиентам” · July 2026 · 3,240 transitions in the slice · the base threshold comes from the widget code
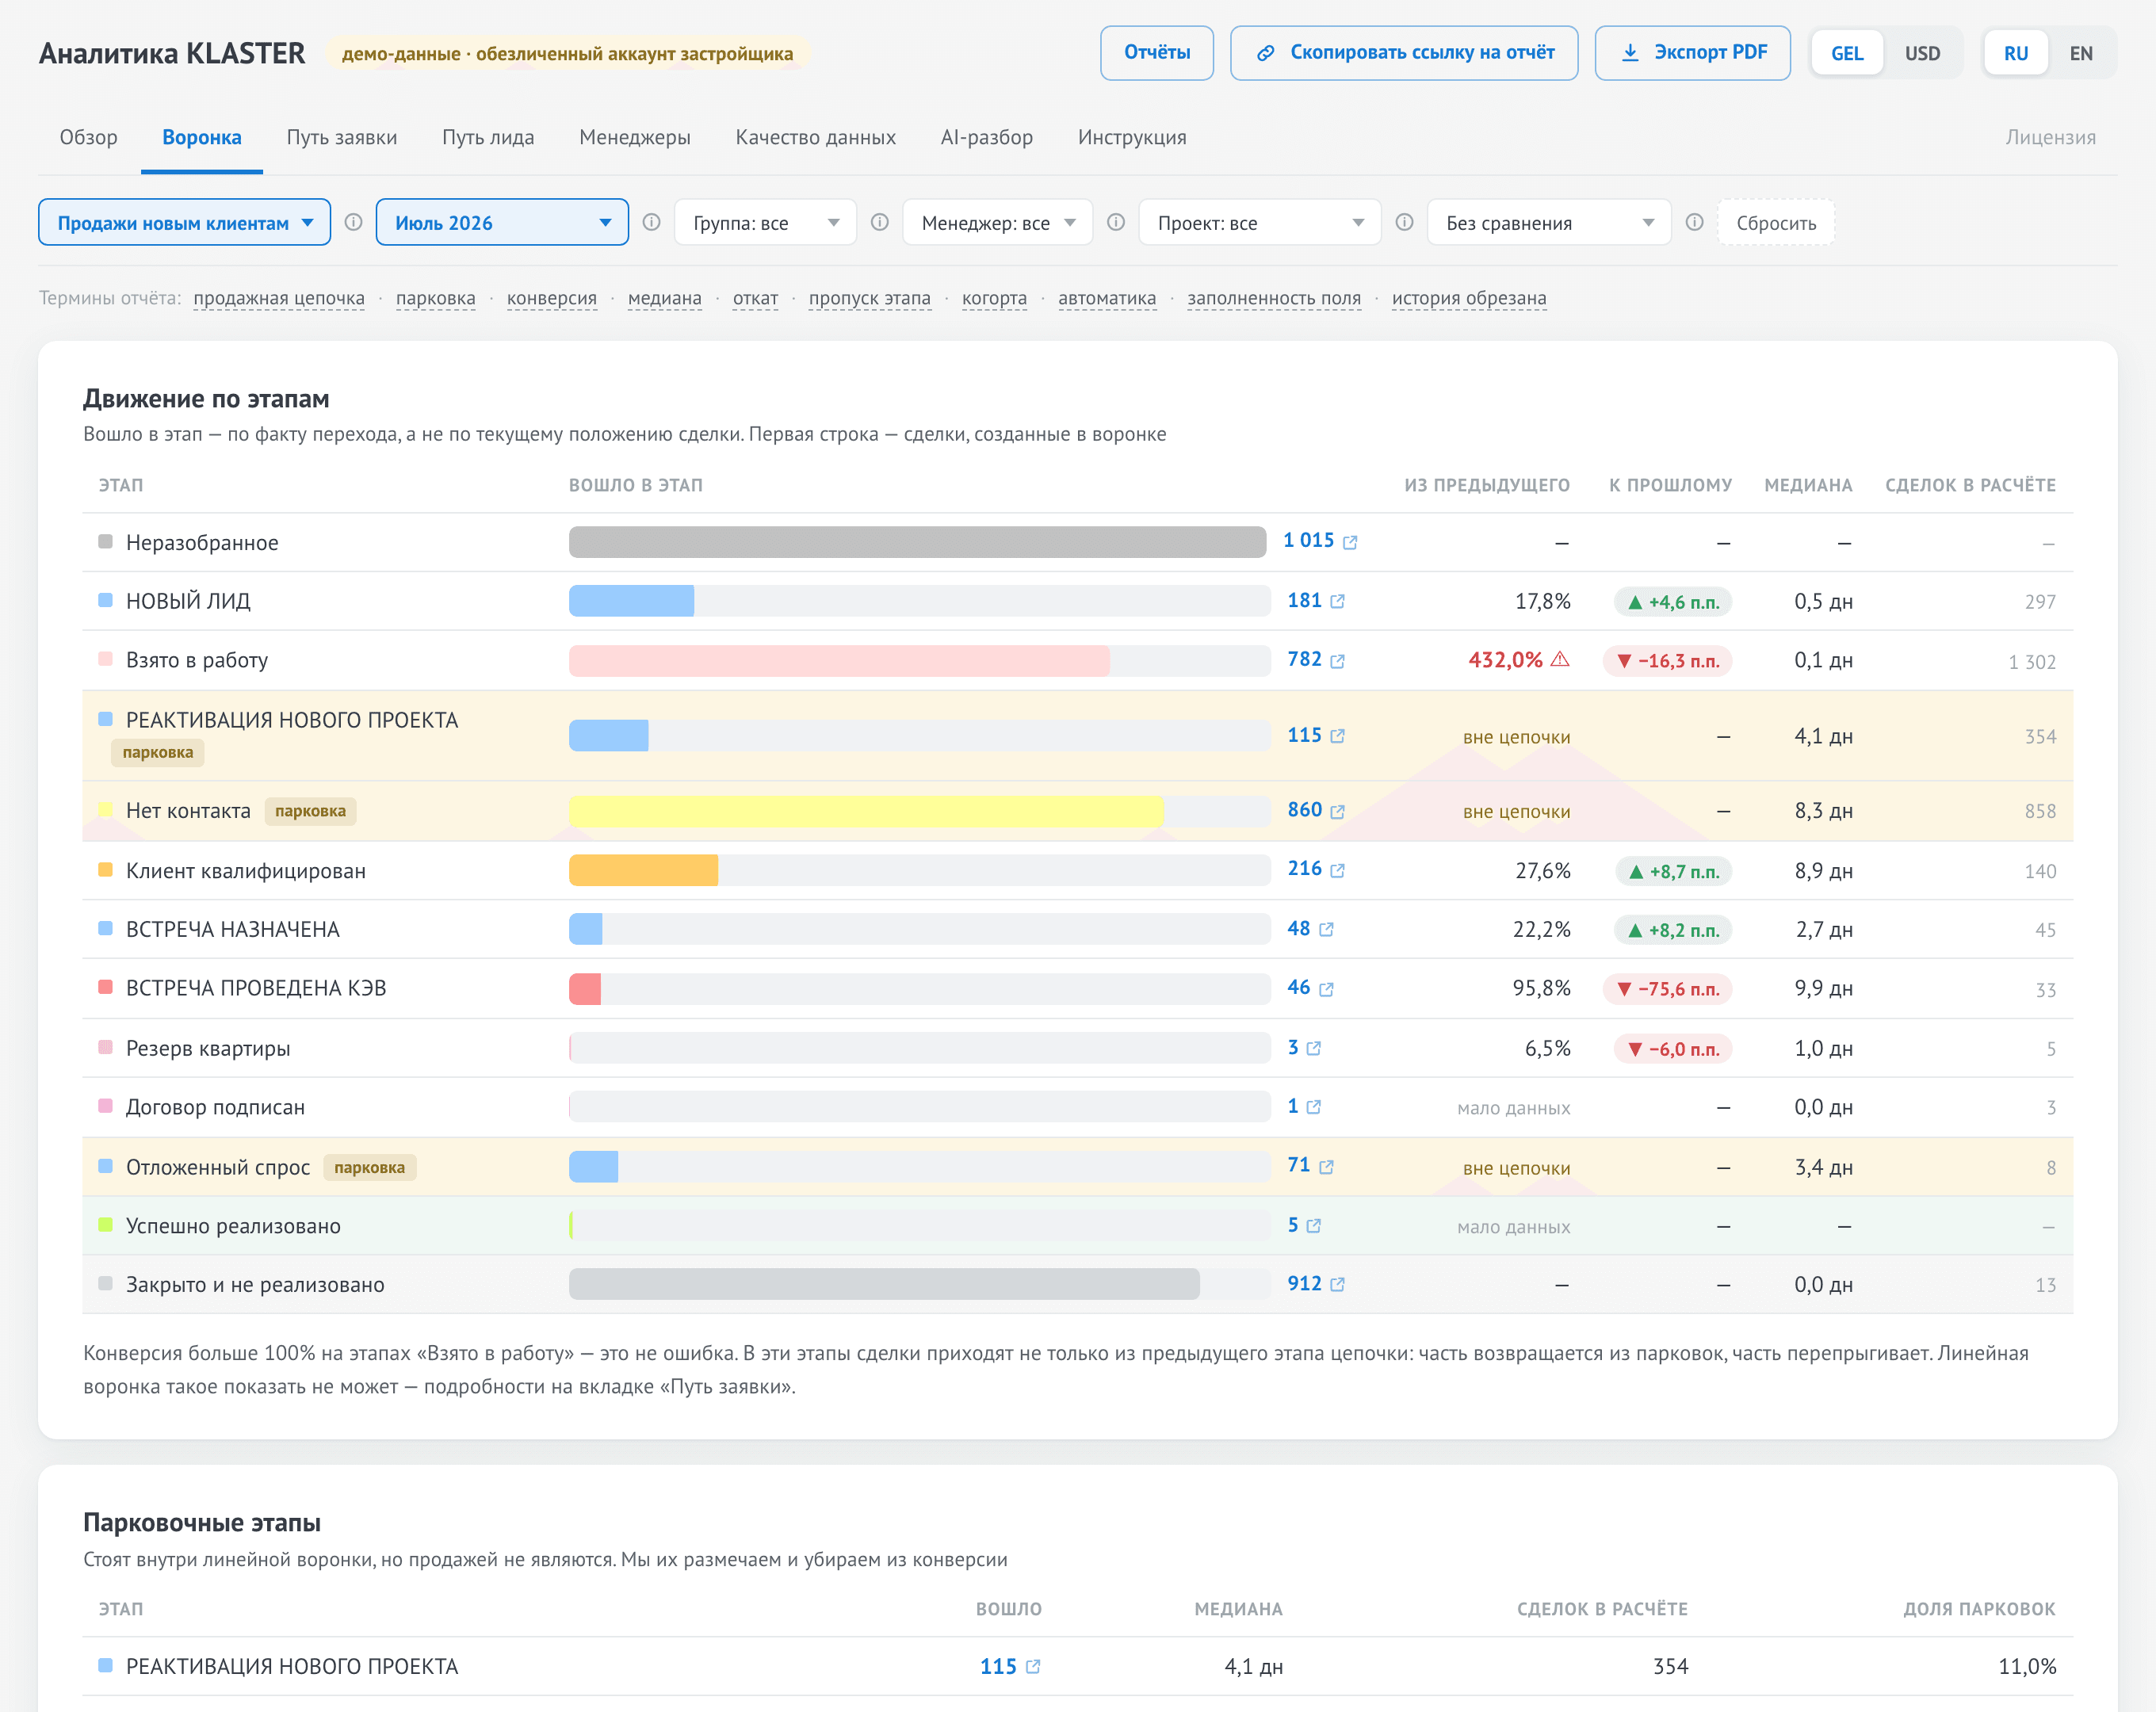
demo data of an anonymised property developer account · July 2026
Jump straight to a tab:
The data is anonymised, the code is real
Company name, subdomain, employee names, project names and addresses are replaced. There are no deals or contacts in the demo at all: even on a live account the widget stores no names, phone numbers or email addresses.
The numbers come from a production account — the funnel here is ugly, as in real life. Calculations, thresholds, verdicts and export are the same as for a paying client: demo and live mode differ in one thing only — where the data set comes from.
A demo session cannot request live data. The mode is set by the address: without a verified session key the report server refuses a demo session outright instead of substituting numbers. The account id comes only from a signed token — you cannot put someone else’s into the address and see their funnel.
Open the demo
The link can be forwarded to a manager or to the team — it opens the same way for everyone.
Next come your pipelines, stages and people. The account administrator grants access with one button and revokes it in the same place; the first load takes 34 minutes on 7 years of the pilot’s history. What is requested at installation.
measured 25.08.2026 · first full load of the pilot account (anonymised property developer account) · docs/РЕШЕНИЯ.md, пункты 37 и 40