The stock “Sales analysis” report understates conversion. We found where, and by how much
The same 32,478 deals in the same account, the whole history. The only difference is the counting method: the stock report runs conversion cumulatively from the first stage and treats any stage where a deal simply waits as a step. We count between adjacent selling steps and move the waiting into a block of its own.
18 points of difference out of nowhere: the same deals, the same history, the same sales. They are eaten by 3 parking stages standing inside the sales chain. We neither delete nor hide them — they stay a separate block with their own numbers, but they no longer zero out the conversion.
anonymised property developer account · 32,478 deals in the history · conversion at “Taken into work”: cumulative versus stage-to-stage
This is not a complaint about amoCRM: the stock report does exactly what its description says. We count differently — and below is precisely where the two counts diverge, so you can check both on your own export.
Where the gap comes from
The stock count runs from the first stage downwards and takes stages in the order they sit in the pipeline. Between “taken into work” and “meeting scheduled” there is a stage where the deal waits for a call or a decision — and it enters the chain alongside the selling ones. The cumulative percentage collapses there, although the sale is not lost: it is queuing.
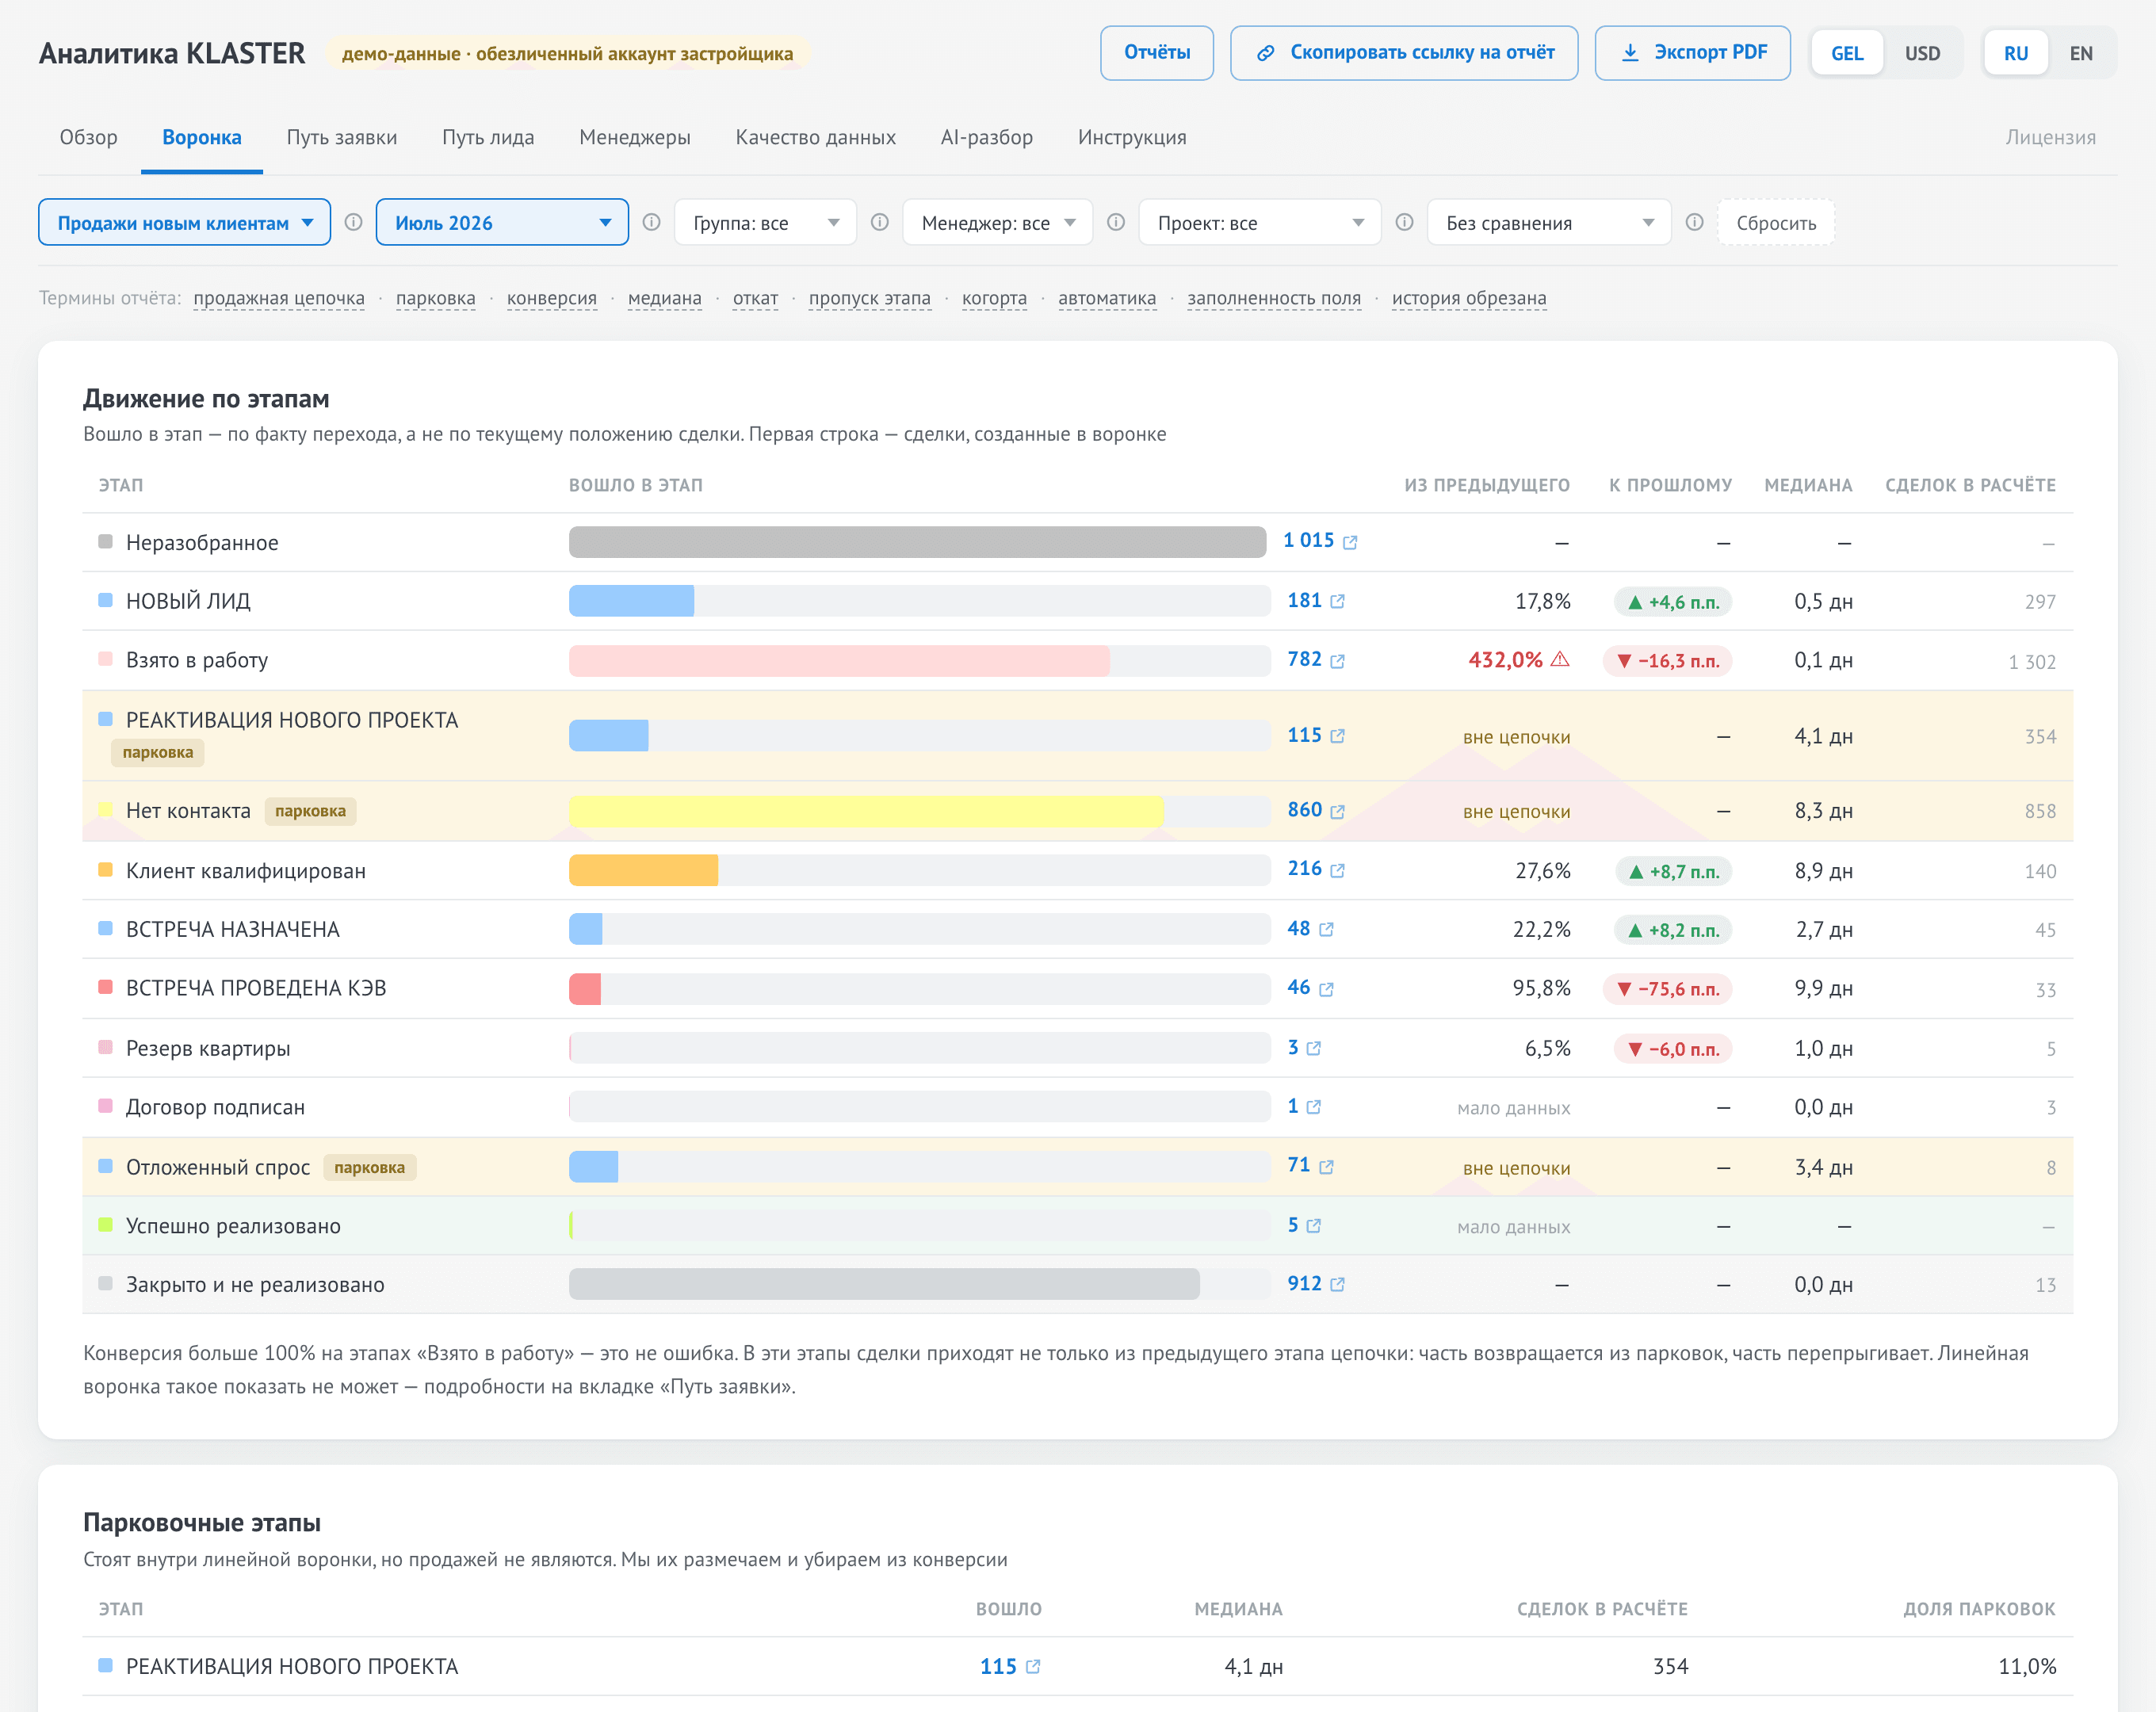
demo data of an anonymised property developer account · July 2026
A parking stage is not an analyst’s opinion
Each of the 3 stages is marked up by how deals behave in it, and the evidence is visible in the interface next to the markup:
РЕАКТИВАЦИЯ НОВОГО ПРОЕКТА
77% of entries come from higher up the pipeline, not from the previous step; of those, 400 come straight from closed and lost deals. That is a return to work, not a step forward.
Нет контакта
1,289 entries, and 70% of exits lead to closure. A step almost nobody moves on from is not a selling step.
Отложенный спрос
85% of exits lead back up the pipeline. From here a deal returns to work rather than moving towards a sale.
anonymised property developer account · June and July 2026 · pipeline 3423622 · shares computed from entries and exits of every stage
The heuristic suggests the markup; a person confirms it. On the full history of the same account the heuristic once labelled as parking a stage from which deals go to revenue — which is why the last word stays with the head of sales. How we count and where we got it wrong
There are not 1,357 skips but 30 — the rest is just waiting
The stock report shows how many deals sit on each stage now, but not how they got there. Movement back up the pipeline and skipped steps are not singled out — and those are exactly the cases where the process departs from the rules.
In July 2026 this pipeline had 3,240 transitions. Of those, 408 are rollbacks: the deal went back to an earlier stage. Another 686 moved to a different pipeline — in a single-pipeline report they vanish from view, while the stitched customer journey shows exactly where they went.
The same 3,240 transitions. Count every jump over a stage as a skip and you get 1,357 things to review, almost all of which only mean the deal did not enter a parking stage. Real skips of a selling step — 30: that fits into a single stand-up.
anonymised property developer account · pipeline 3423622 · July 2026 · transitions rebuilt from event history, including the synthesised first entry
Automation gets its own row: 5.3% of the month’s transitions were made by a bot, not a person. They are excluded from the team median — automation conversion must not be credited to a manager.
anonymised property developer account · July 2026 · share of transitions authored by “automation”
Differences point by point
8 points, and each one is not an opinion but a difference in counting method, visible on one and the same account.
| Point | Stock report | KLASTER |
|---|---|---|
| Conversion | Cumulative from the first stage | Between adjacent stages of the sales chain |
| Parking stages | Counted as funnel steps | Marked up and taken out of the calculation |
| Pipelines | One at a time | Several at once, with the customer journey stitched across them |
| Custom fields | Text inputs in the filter | Full breakdowns with a list of values |
| Period comparison | None | Yes; a full month is compared with a full month |
| Rollbacks and skips | None | Yes, with naive skips separated from real ones |
| Cohorts by creation date | None | Computed in the report core; no switch in the interface yet |
| One screen — one period | Top and bottom blocks cover different periods with no label | One slice for every tab |
two reports compared on an anonymised property developer account · pipeline 3423622 “Продажи новым клиентам” · July 2026 · REST API v4 and the stock “Sales analysis” screen
The last row is the one that starts arguments about numbers at the stand-up. With a one-week filter the top block of the stock screen shows only that week’s new deals, while the bottom block on the same screen shows all 32,478 deals in the account’s history, and nothing says so. That is where “the data does not add up” comes from: two numbers on one screen counted over different periods.
Check it on your own numbers
All 8 points can be checked on the data: the demo opens the widget itself on the same export and without sign-up, while the “stock report / KLASTER” switch sits on the product page. Then comes your account: the administrator grants access with one button and revokes it in the same place.