Metrics and formulas
Where every number in the report comes from: what is in the numerator, what is in the denominator, what is left out and how to verify the figure by hand in amoCRM itself.
anonymised property developer account · “Продажи новым клиентам” pipeline · July 2026 · counted from status-change events
The unit of counting is a transition, not a deal
The report counts transitions, not deals: one row per status change, keyed by the deal and its sequence number within it. A deal moved six times in a month is six rows to the report. All the formulas below follow from this, and so does the difference from familiar lists: in the demo pipeline in July 2026, 1,015 deals were created, but there were 3,240 transitions.
transition = deal · No. · from · to · when · who
A transition is built from a single amoCRM event: the status-change event already carries the previous status with its pipeline, so there is no need to reconstruct the chain from earlier events. Two cases where there is no event at all:
- Creating a deal produces no status-change event. The widget synthesises the first entry into the pipeline from the creation date and flags it. The “who” field of such an entry is empty: the deal author cannot be put there — for leads from web forms, the API and the mail parser it matches the automation code, and all 1,015 deals of the month would go to the bot.
- The earliest known transition has no previous status — meaning the history before it is unavailable. Such a transition is flagged as truncated, and time on the previous stage is not computed for it.
“Entered the stage”: flow and cohort
These are two different counts, and confusing them is the most expensive mistake: they answer different questions and give different numbers on the same data.
Flow
how the widget countsentered(stage) = how many transitions arrived at the stage in the period
Selection is by transition date. Deals created at any time count — including last year’s. A deal that returned to the stage twice gives two units: these are transitions, not unique deals. The question flow answers: what happened in the team in the chosen month.
Cohort
no switch yetentered(stage) = how many distinct deals of the period visited the stage
Selection is by deal creation date, and the transition date is not limited at all: a July lead may have reached a meeting in September and still counts in the July cohort. Deals are counted as unique. A different question: what became of the leads that arrived in July.
The cohort query is written in the report core, but there is no mode switch in the widget today: every tab is computed as flow. Half of the question is covered by the caption under the “Overview” tiles — “of them new · from earlier periods”: it shows what share of the flow came from deals created in the same period. That is not a cohort but its shadow, and we call it that rather than passing it off as a cohort report.
There is also a third count that gets mistaken for the first two: the deal list in amoCRM itself filters by current status. “Entered the stage” and “currently on the stage” are different statements and need not match. In the demo pipeline, “Нет контакта” received 860 transitions in a month — that number says nothing about how many deals sit there now.
The first row of the funnel is “created”, not “entered”: the entry into the first step is synthetic, so the widget shows the number of deals created in the pipeline in the period. The conversion table below starts with the same row — it serves as the denominator of the first step.
anonymised property developer account · “Продажи новым клиентам” pipeline · July 2026 · counted from status-change events
Conversion — between adjacent steps
conversion(k) = entered(step k) ÷ entered(step k−1) × 100
The denominator is the previous step of the sales chain, not the pipeline entry. The chain includes only stages marked as selling; parking stages, “Unsorted” and both finals are not in the denominator. The cumulative count from the first stage is a different metric, and it is the one that produces a drop out of nowhere when a parking stage sits inside the chain.
| Step | Entered the stage | From previous | How it was computed |
|---|---|---|---|
| created in the period | 1,015 | — | top of the chain: no denominator |
| НОВЫЙ ЛИД | 181 | 17.8% | 181 ÷ 1,015 |
| Взято в работу | 782 | 432% ⚠ | 782 ÷ 181 |
| Клиент квалифицирован | 216 | 27.6% | 216 ÷ 782 |
| ВСТРЕЧА НАЗНАЧЕНА | 48 | 22.2% | 48 ÷ 216 |
| ВСТРЕЧА ПРОВЕДЕНА КЭВ | 46 | 95.8% | 46 ÷ 48 |
| Резерв квартиры | 3 | 6.5% | 3 ÷ 46 |
| Договор подписан | 1 | not enough data | base 3 — fewer than 8 |
anonymised property developer account · “Продажи новым клиентам” pipeline · July 2026 · counted from status-change events
«Успешно реализовано» (5) and “Закрыто и не реализовано” (912) are finals, not steps: they are not in the chain and never enter the denominator. We still show them as numbers: without them the movement through the funnel does not add up, and closure is the largest row of the month.
The weakest step of the demo funnel is “ВСТРЕЧА ПРОВЕДЕНА КЭВ → Резерв квартиры”: 6.5%. The cumulative ladder smears this spot across the whole funnel; the stage-to-stage count points at it directly.
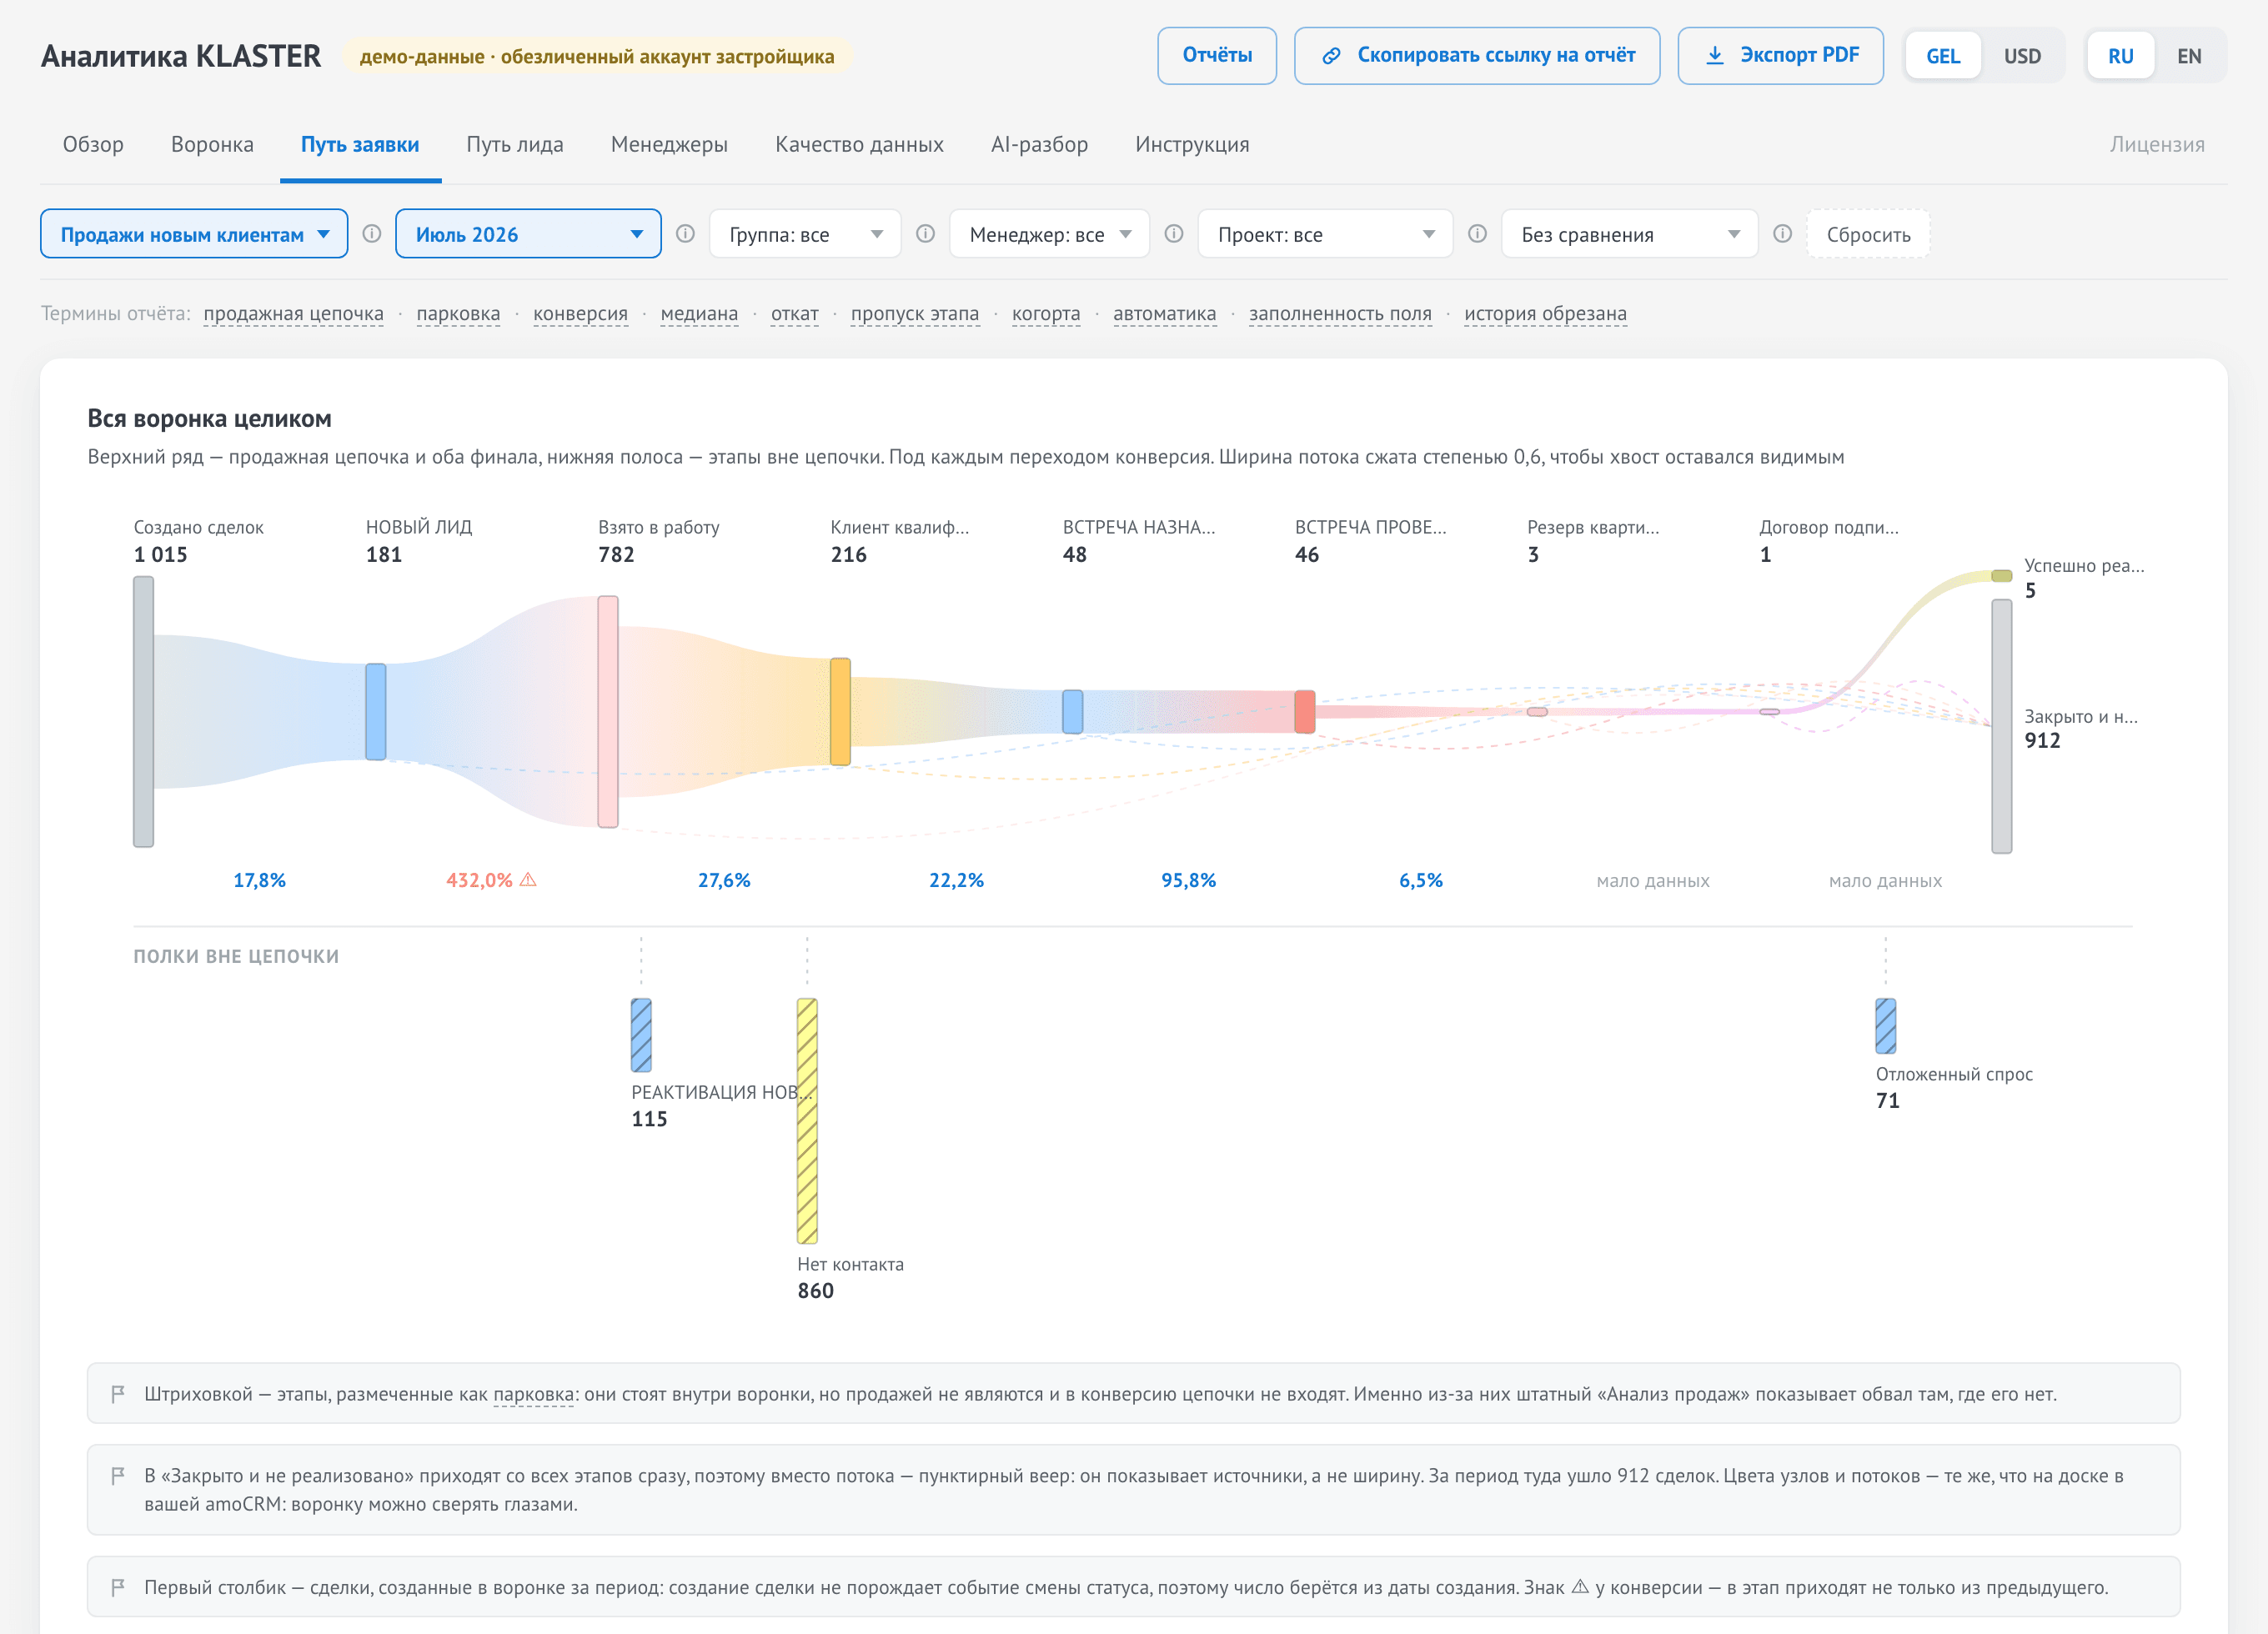
demo data · anonymised property developer account · July 2026
Over one hundred percent is not an error
In the demo pipeline this is how “Взято в работу” behaves: 432% — deals arrive there not only from “НОВЫЙ ЛИД”; some return from parking stages, some come directly or from another pipeline. A value above 105% is flagged and stays on screen. Hiding it would mean fitting the funnel to an idea of how it should look. The only restriction: comparing periods on such a pair is meaningless — the AI review skips such pairs rather than presenting them as a trend.
Fewer than 8 deals — no percentage
You see “not enough data” instead. Percentages from two deals are never reliable. In the table above it is the last step: base 3, and a label stands in place of the percentage. Both numbers remain visible — the refusal applies only to the division.
Median time, not average
time on stage = seconds between leaving the stage and the deal’s previous transition
median = the middle value: half are faster, half are slower
One stuck deal must not distort the picture for the whole team. Time is measured on exit from the stage: the duration is carried by the “stage → next” transition, so a stage’s row is computed over deals that left it. Hence the main limitation to know before talking to the owner: a deal still sitting on the stage is not in the median. Next to the median is the “Deals in calculation” column — it shows how many observations the number is based on.
Excluded from the time calculation:
- The deal’s first transition — there is no previous transition, so there is nothing to derive a duration from.
- The transition right after truncated history. A deal created long before the available history begins — on the pilot it goes back 7 years — would bring years of idle time into the median: instead of time on stage it would be time before the export started.
- The average. The words “average time” appear on no screen of the widget: one stuck deal shifts the median by one position but breaks the average entirely.
Rollback
rollback = the target stage comes before the source stage, within one pipeline
The order is the same as in the CRM itself. A transition to another pipeline is not a rollback: it has its own stage numbering, and “earlier” means something else there. In July 2026 the demo pipeline had 408 rollbacks out of 3,240 transitions.
A rollback in itself is not a violation. A single return is a normal working situation; many rollbacks from one stage mean the stage is passed pro forma, and the stage deserves the look, not the people.
Skip — and why skipping a parking stage is not a skip
skip = a selling stage lies between the source and target stages, and the target stage is a selling one
Both conditions are mandatory. Without the second, every deal closure is recorded as a skip: final statuses are ordered at the very end of the pipeline, and between “taken into work” and a loss formally lies the whole remaining chain. The deal was not “jumped over the stages” there — it was closed.
The same data. The whole difference is whether entering a parking stage and closing a deal count as skips: neither is movement along the sales chain.
anonymised property developer account · “Продажи новым клиентам” pipeline · July 2026 · counted from status-change events
What is not a skip:
- Entering a parking stage. A parking stage is outside the sales chain: entering it is no movement along the chain. Which stages are marked as parking and why a person confirms it — in the markup section.
- Closing a deal — neither a win nor a loss.
- A transition to another pipeline — it has its own flag.
- A rollback. Going back along the chain, there is nothing to skip.
- A transition whose stage was deleted from the CRM. There is no order to compare against, and we set no flags at all — a lying flag is worse than a missing one.
Cross-pipeline transition
pipeline change = “from” pipeline ≠ “to” pipeline
Such a transition is neither a rollback nor a skip — both flags make sense only within one pipeline. In the demo pipeline in July 2026 there were 686 transitions between pipelines. The stock report does not show this work at all: it looks at one pipeline at a time.
The counter counts transitions in both directions — entries into the selected pipeline and exits from it — otherwise an exit would be invisible. The other summary counters (total, rollbacks, skips) count only transitions into the selected pipeline. That is why the summary rows do not add up to “total”, and it is not a report error.
Automation and who gets credit for a transition
automation = the transition was made by a bot, not a person, and the entry is not synthetic
Transitions made by a bot are excluded from the team median: automation conversion must not be credited to a person. On the pilot, automation made 5.3% of all transitions: hand them out to people and the team median improves by itself, without a single call.
The second rule of the same formula is who gets credit for a human transition. It goes to whoever owned the deal at the moment of the transition, not the current owner. If the owner-change history does not cover this deal, the transition goes to the “not attributed” row: putting the current owner there is exactly the bug the history is loaded to avoid.
The team median covers selling groups only, and only those with at least 20 deals in the base within the slice. Support, the partner team and the office do different work, and a combined figure would mislead in both directions.
Period comparison
The widget picks the comparison period itself, but by a rule you can verify. There are three rules, in this order:
| What period A is | Period B | Why |
|---|---|---|
| Comparison period set manually | The one set | The manager’s explicit choice outranks any default rule. |
| A full calendar month | The whole previous calendar month | July has 31 days, June has 30. A “same length in days” window would reach one day into May, and the manager would compare July with 31 May – 30 June. July is compared with June. The rule applies only to a whole month — from the first day to the last; a range of two consecutive months goes by the third row. |
| An arbitrary date range | A window of the same length, immediately before | For seven or thirty days the calendar does not matter; equal length does. |
Both ranges are labelled with dates right above the tiles: “vs. previous period” without dates can be read any way. Deltas are computed in two ways and never mixed: counts as a difference in units, conversion in percentage points, not as a percentage of a percentage. If the previous range is not in the data, the comparison column is empty and labelled “nothing to compare with” — it is not replaced with zero, since zero would mean “nothing happened”.
Thresholds at which a number is not shown
| Threshold | What it does | Where it shows |
|---|---|---|
| 8 deals | Below it — no percentage, “not enough data” instead. The numbers themselves are shown. | “Funnel”, “Lead path”, the “Overview” tiles, bottlenecks. |
| 20 deals | Below it — no percentage for the person, and they are excluded from the team median. | “Managers”: a label instead of a percentage in the conversion column. |
| 105% | Above it — a ⚠ marker and an explanation. The value stays on screen. | “Funnel”, “Lead path”, “Overview”. |
| 60% / 30% | Field completeness: above 60% the breakdown is built silently, between the thresholds — with a warning, below 30% it is not built without explicit confirmation. | “Data quality” — a separate section of the docs. |
How to verify a number by hand
A metric that cannot be verified cannot be defended. The verification order is:
- A number in the report is a link. A click opens the deal list in your amoCRM in a new tab, with the filter applied: pipeline, stage, period, owner.
- The lists need not match. We count “entered the stage” from status-change events in the period; amoCRM filters the list by the deal’s current status. A difference here is not an error but a difference in questions.
- Checking one deal. Open the card and the status history: every change is one transition row in the report, the creation date is the synthetic first entry. Two or three deals show whether the count adds up.
- Checking “created”. Filtering the deal list by creation date for the same period gives the number in the first row of the funnel.
What the metrics do not include
A “flow / cohort” switch
in progressThe cohort query is written in the report core; there is no interface for it. Every tab today is computed as flow, and the page says so rather than implying it.
Revenue metrics
not countedThe sum of won deals is computed from filled-in price fields and is therefore incomplete. On the pilot the “Бюджет сделки” field is filled in on 10% of deals — we will not compute revenue and ROI on such data. What to do about it — in the data quality section.
Global counters inside a slice
by designRollbacks, skips and the automation share are computed for the whole pipeline. With a manager, group or project filter on, these blocks stay silent rather than passing off the global numbers as the slice.
Call and task metrics
plannedThe widget counts movement through the funnel. Activity — calls, messages, overdue tasks — is not in the sync yet, and there are no reports on it.
The full counting rules, including those that did not fit on this page — on “How we count”. Our own parking-stage markup error, which produced the rule “the heuristic suggests, a person confirms” — on “Parking stages”. How these formulas differ from the stock report, by measured differences — in the comparison.