We show where your funnel loses deals and count conversion without parking stages in the way
A widget for amoCRM that counts stage-to-stage conversion, takes parking stages out of the calculation and refuses to build a report when there is not enough data to count on. Nine tabs on one filter. Version 1.1.8, interface in Russian and English.
version 1.1.8 · amoCRM technical account since 26.08.2026 · base price set in US dollars, web/lib/pricing.ts
Does this sound like your sales team?
“The report says one thing, the gut says another”
We mark up parking stages, take them out of the calculation and count conversion between adjacent steps, not cumulatively from the first.
“Funnel” tab
“Deals hang and never close”
We show how much sits on parking stages, for how long and where it goes next. A parking stage is waiting, not a loss, but it cannot be a step of the funnel.
“Lead path” tab
“No idea where leads get lost”
We break down every transition: who moved a deal, when and where to. On the pilot, 408 of them in a month were moves back down the funnel — the stock “Sales analysis” report has no such row.
“Overview” tab
“Nothing to compare managers against”
We credit a transition to whoever owned the deal at that moment, not the current owner. The team median covers selling groups only.
“Managers” tab
rollback count — anonymised property developer account, July 2026, from status history
See what it looks like
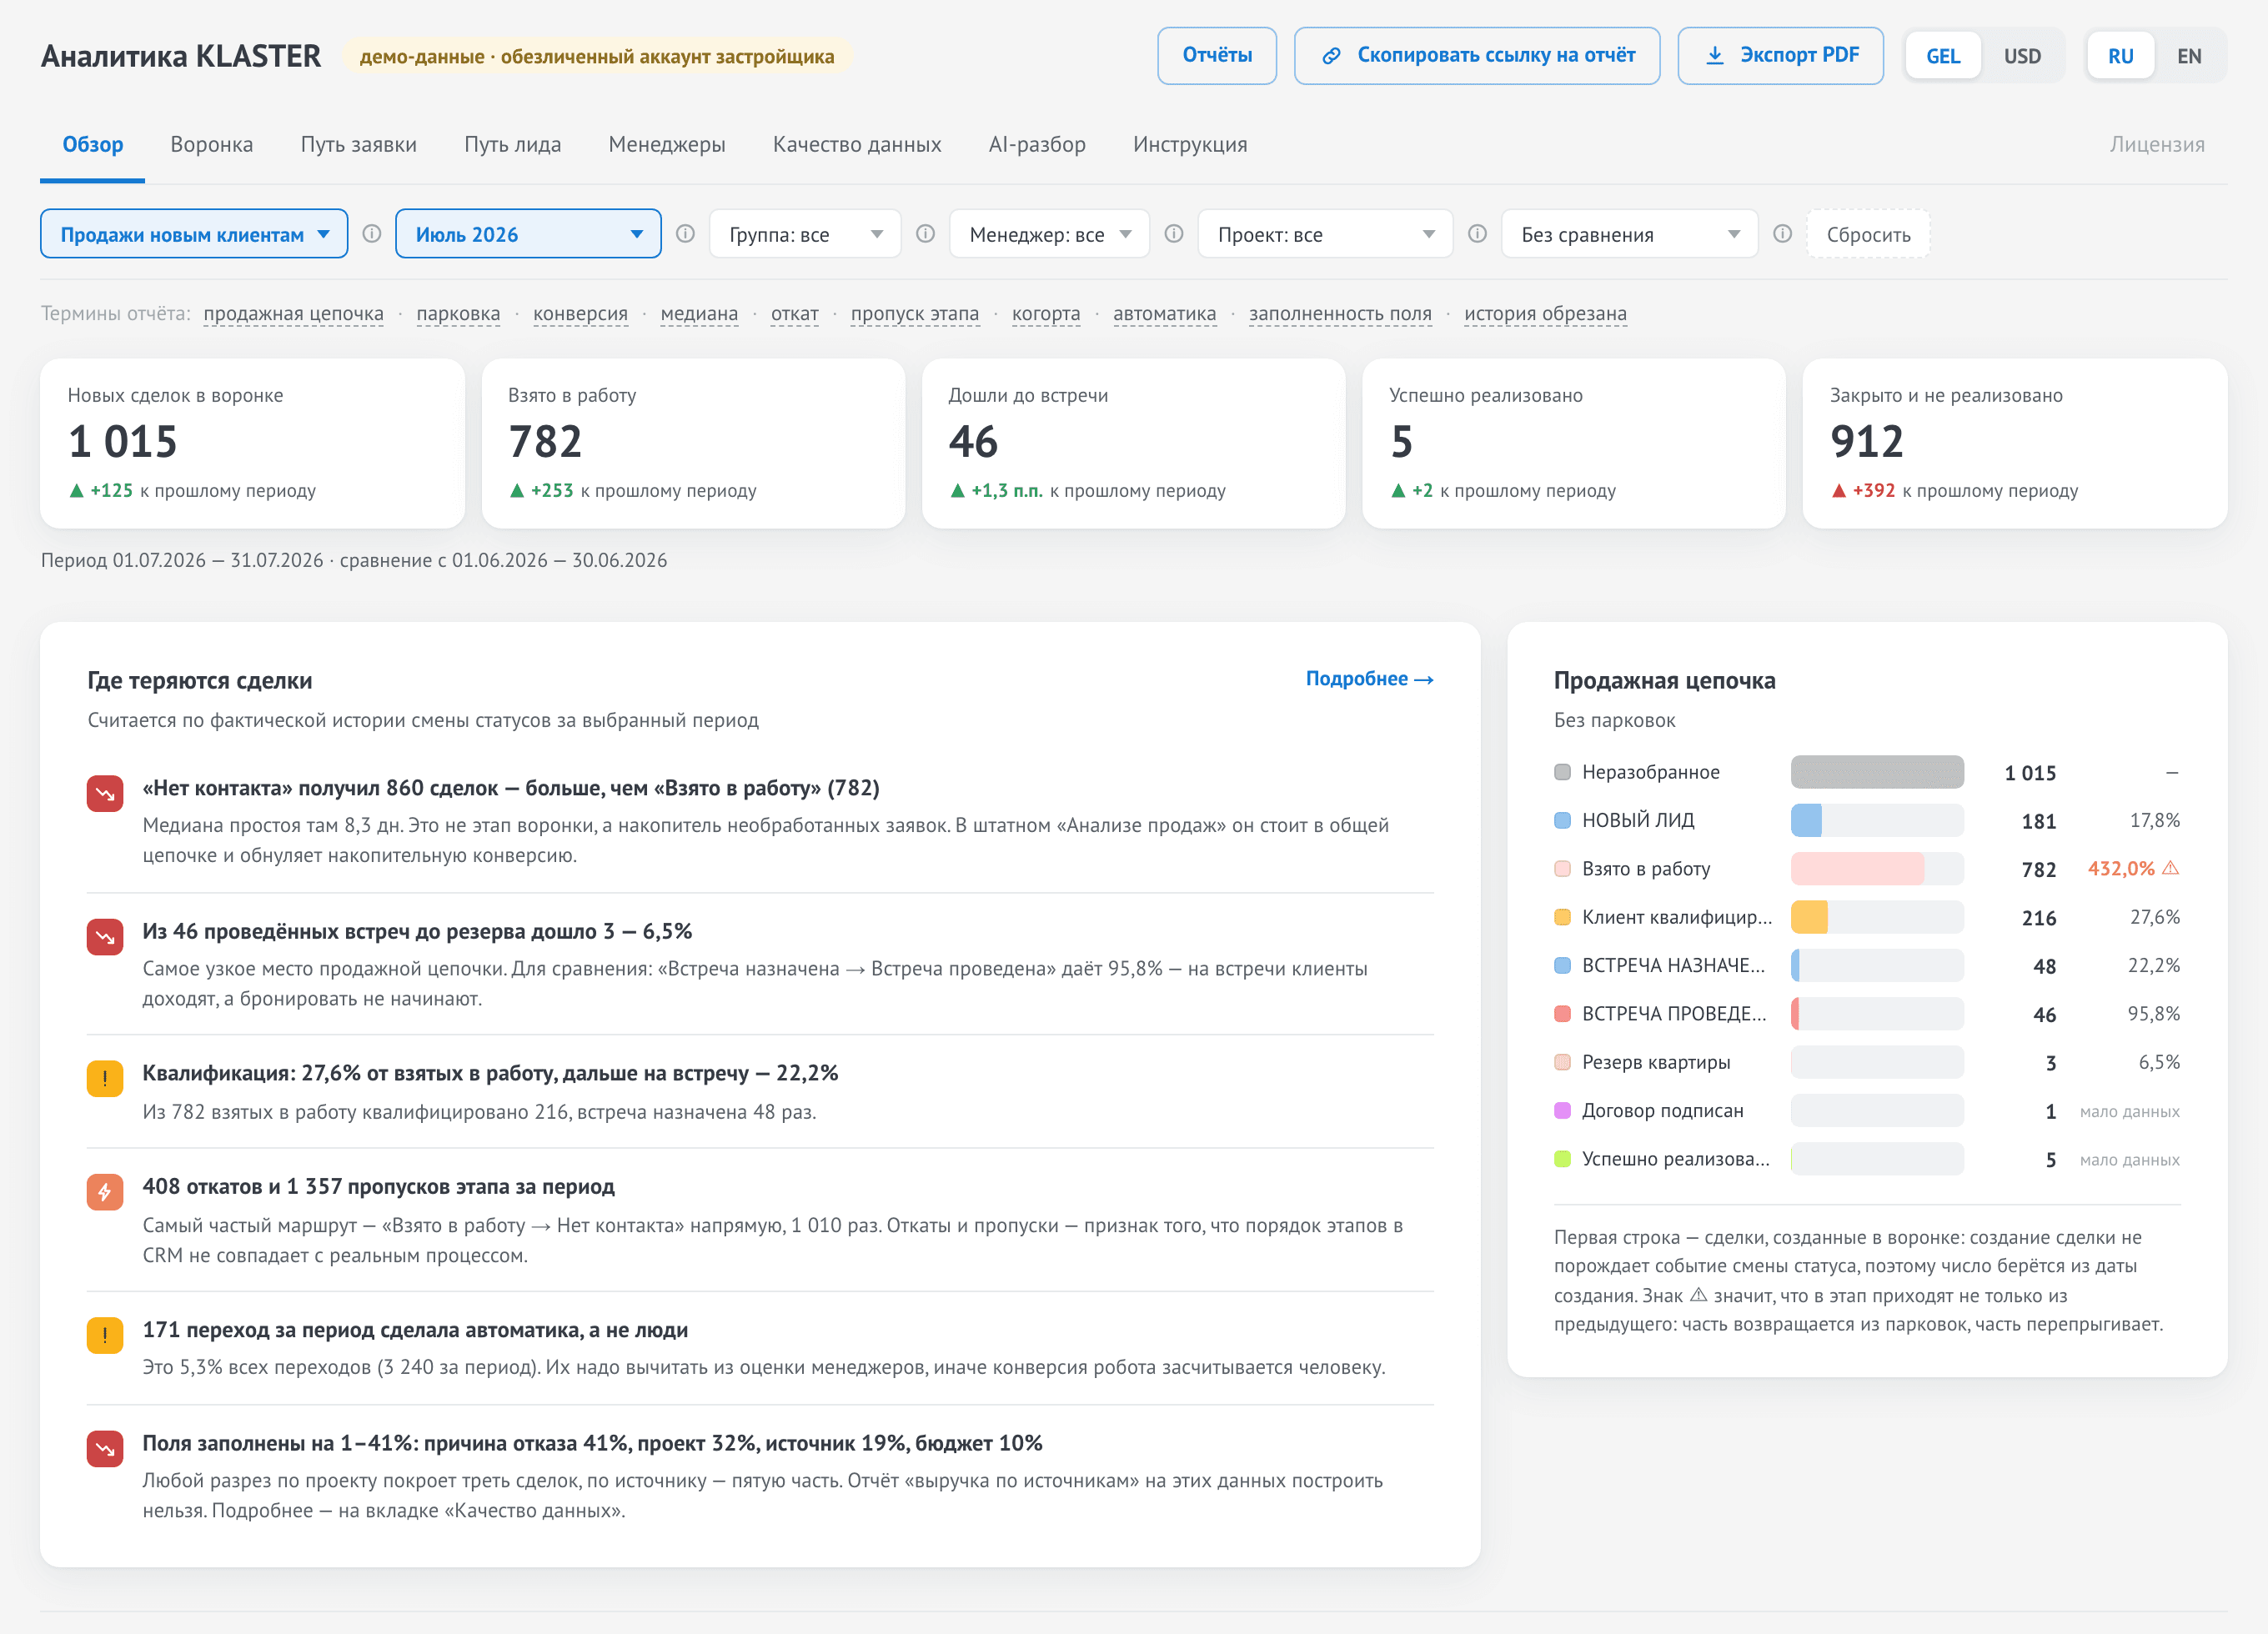
demo data of an anonymised property developer account · July 2026
Look at one slice from nine angles
Pipeline, period, group, manager, deal field — one filter for every tab. Switching tabs resets nothing.
Overview
The whole slice on one screen: entries per stage, conversion, median time, delta to the previous period. On a full month — plan, actual and a pace forecast.
Funnel
Conversion between adjacent steps of the sales chain. Parking stages sit in a separate list with their own numbers.
Lead path
Where a deal goes after each stage and how long it stays: rollbacks, skipped steps, exits to other pipelines.
Customer journey
The path is stitched across pipelines. On the pilot, 686 cross-pipeline transitions in a month — work the stock report does not show at all.
Managers
A transition is credited to whoever owned the deal at that moment, not the current owner. The median covers selling groups only.
Data quality
Completeness of every field and a straight verdict: build, build with a warning, or do not build.
AI review
Insights are computed by detectors in code and work without a connected model; the model only explains. Employee names never leave the browser.
Licence
Plan, term, key, trial days. Support in one click, with the account and version pre-filled.
Guide
The counting rules inside the widget itself: what each tab shows and why the numbers differ from the stock report. Open on every plan.
anonymised property developer account · July 2026 · cross-pipeline transitions are counted from status history
We count differently from the stock report — here is the difference
Same deals, same period. amoCRM counts every stage in a row, cumulatively from the first: a parking stage sits inside the chain and zeroes out the conversion, although the deal is not lost there — it is waiting.
anonymised property developer account · “Продажи новым клиентам” pipeline · 32,478 deals in the base · method: conversion between adjacent stages of the sales chain
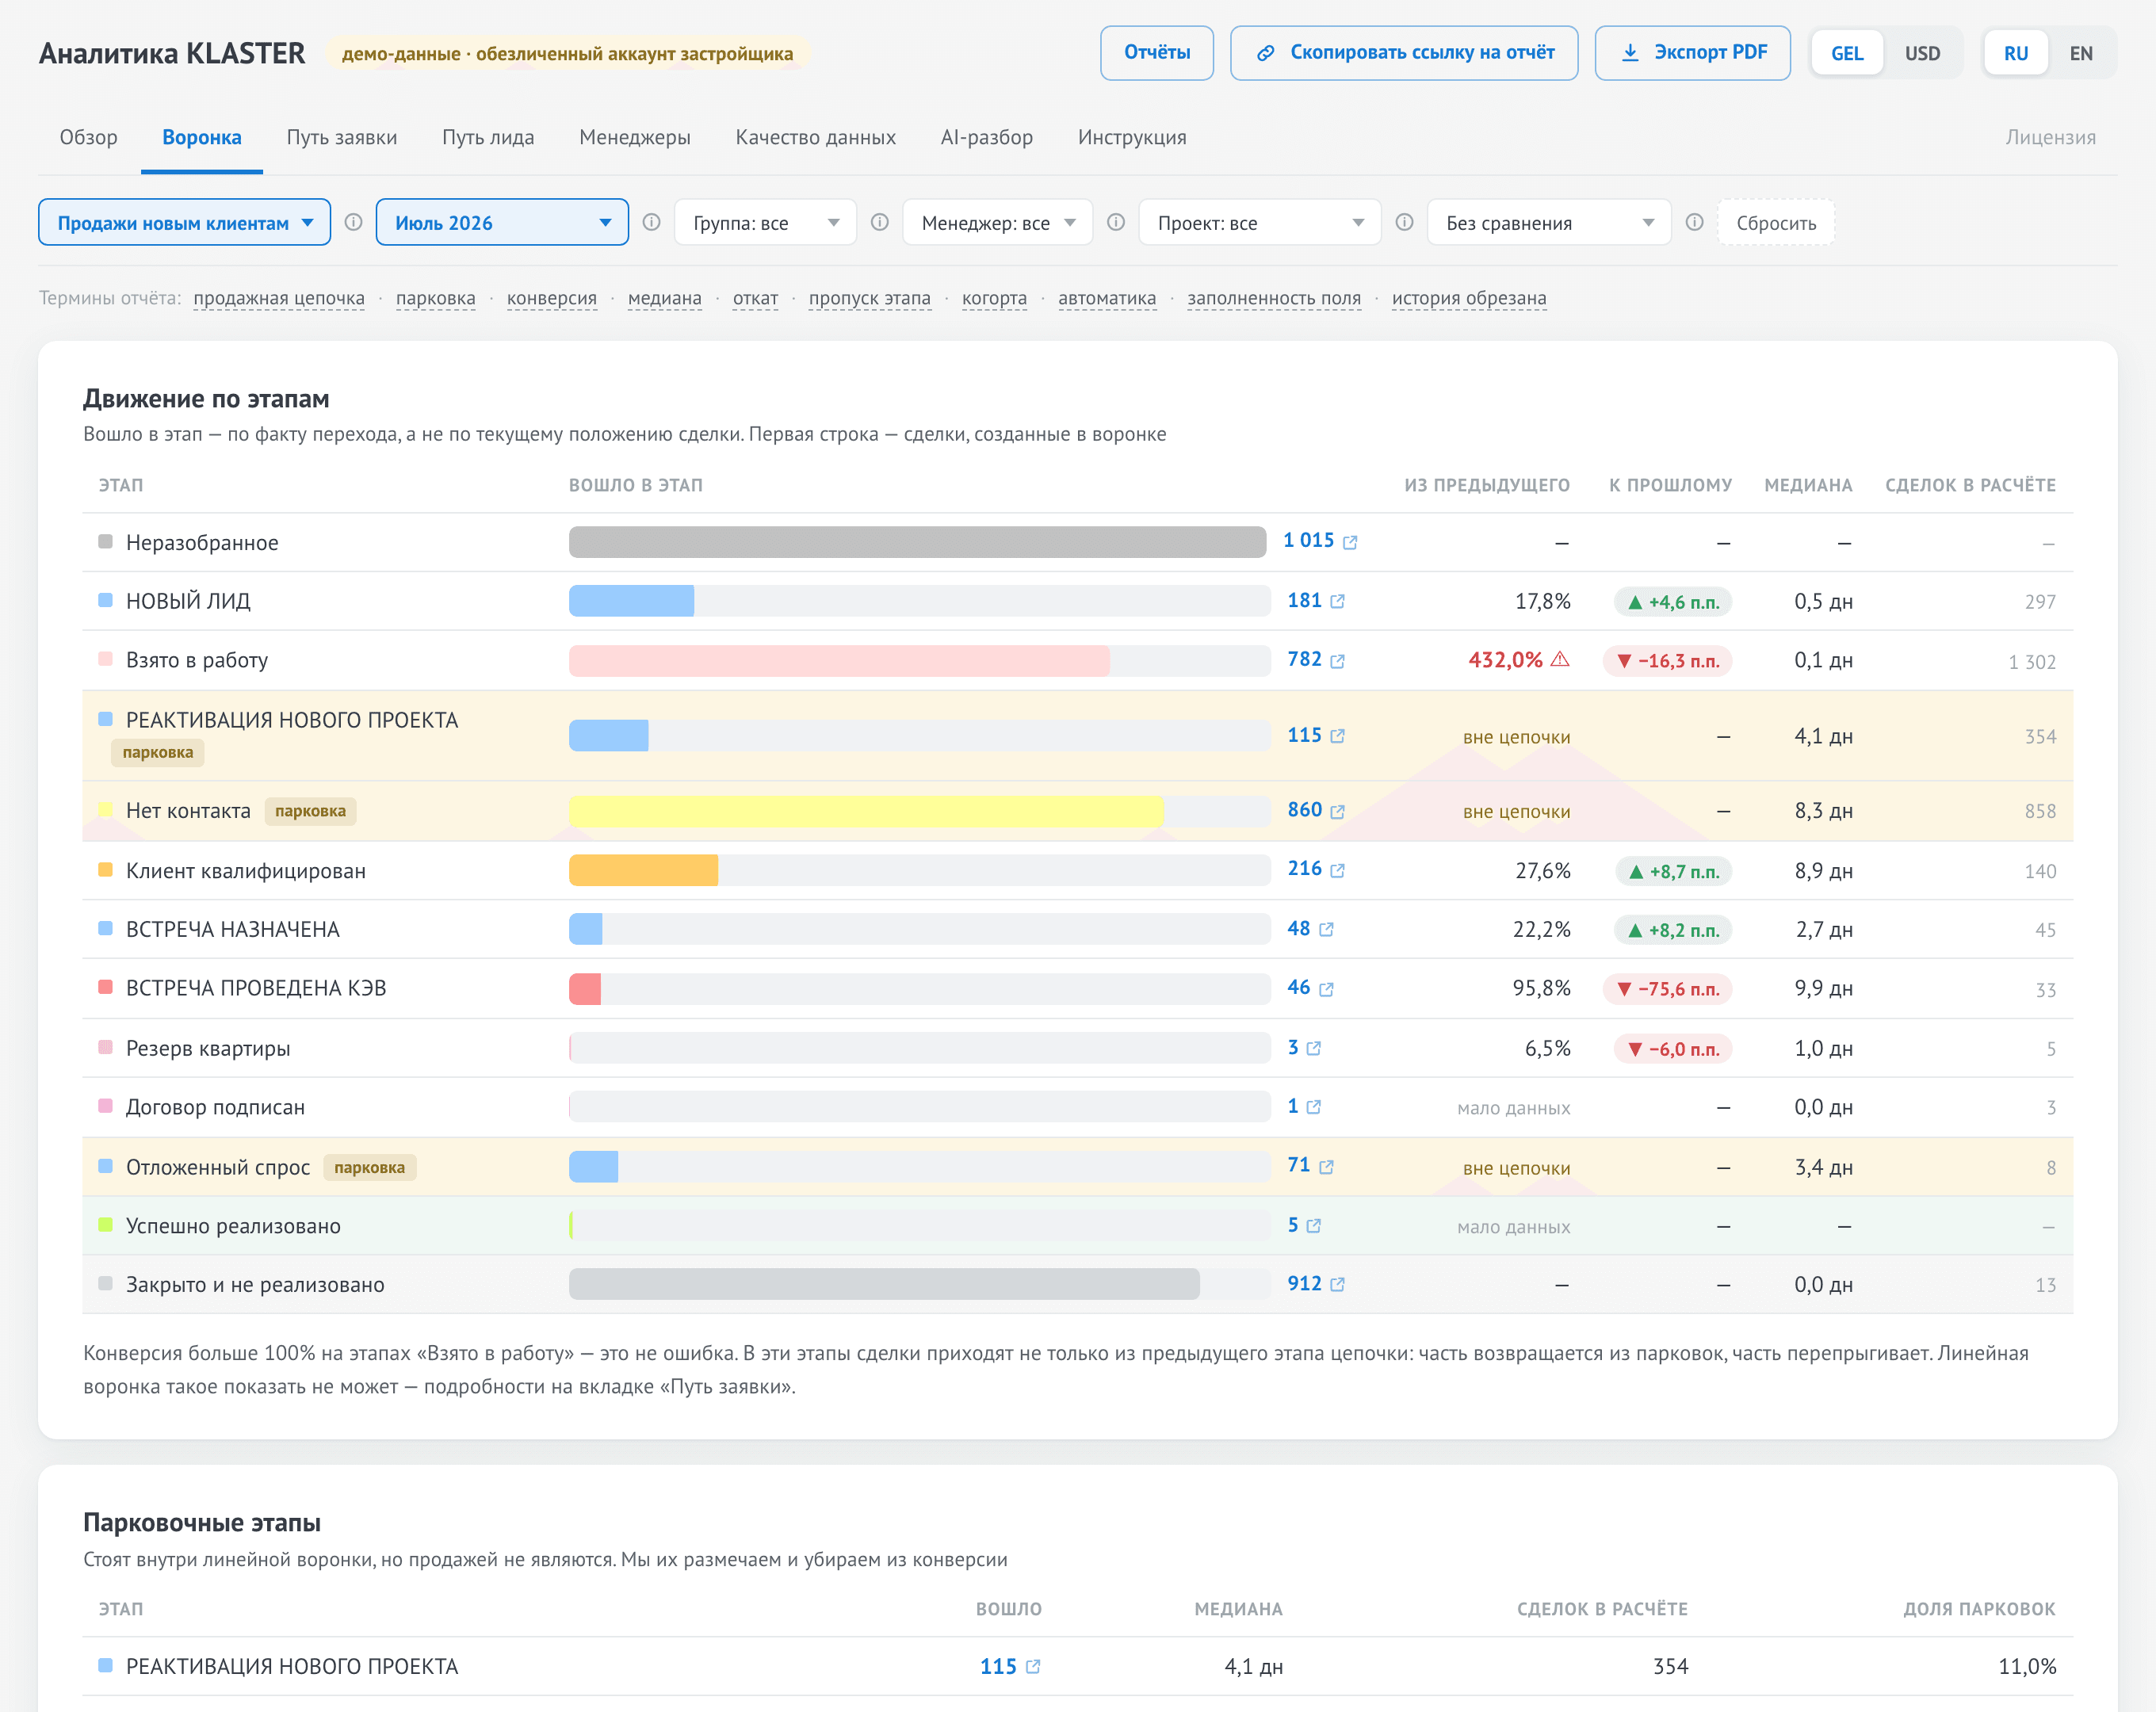
demo data of an anonymised property developer account · July 2026
The transitions are the same. The difference is whether entering a parking stage or closing a deal counts as a skip: neither is movement along the sales chain. The widget shows both numbers side by side — the skip formula is explained in the docs.
July 2026 · 3,240 transitions analysed, 408 of them rollbacks · rule: skipping a parking stage is not a skip
Toggle it and watch what changes
Left — how the stock report counts. Right — how we count.
Продажи новым клиентам
July 2026 · deals created: 1,015 · transitions: 3,240
Another 912 transitions in July 2026 went to “Closed and lost” (Закрыто и не реализовано). It is the largest number of the month and we do not hide it: with it the total is exactly 3,240.
The counting rules are code, not a declaration
Median, not average
One stuck deal must not distort the picture for the whole team.
Fewer than 8 deals — no percentage
You see “not enough data” instead. Percentages from two deals are never reliable.
Completeness below 30% — no breakdown
We show how much is filled in and explain why the number would mislead. The threshold can only be bypassed via support: there is no “show anyway” button yet.
Automation on its own line
Transitions made by a bot are excluded from the team median: automation conversion must not be credited to a person.
The other rules — conversion above one hundred percent is not hidden, “not calculated” is not zero, the team median covers selling groups only — are explained on the How we count page.
What the widget will not do
No report when there is nothing to count on
This is what field completeness looks like on a live property developer account. We will not build a breakdown by source on this data, nor a revenue report: it would be a pretty lie. The threshold is hard: a field filled in for fewer than 30% of deals gets no breakdown, and you see why.
July 2026 · share of deals with the field filled in · 8 fields out of 104 on the deal card
What we do not have yet
No testimonials yet
We have clients and are asking them for written reviews. We do not publish invented ones.
One case study, anonymised
It proves the stock report understates conversion. Sales growth after us is still being measured.
We do not count revenue growth
On the pilot only 10% of deals have a budget and the stock amounts are broken. We do not compute ROI out of thin air.
Not in the amoCRM marketplace yet
The listing is under review; amoCRM does not publish timelines.
No automatic card payments
We issue the key manually within a business day and invoice your company.
No webhook receiver yet
Data freshness runs on a schedule: an incremental sync every five minutes.
The list is public. What we are doing about each item is on a separate page: what we cannot do yet.
You pay per account — from $19 a month
The higher the plan, the more pipelines, history and sections you get on one slice. None of them trims numbers or stamps watermarks: a locked section simply does not open.
Start
$19 / month per account
One pipeline and a team of up to 10. Funnel with parking stages marked up, managers, data quality, licence.
Pro
$39 / month per account
All pipelines in the account, unlimited users. Every section, including lead path, customer journey and AI review.
Developer
$89 / month per account
Everything in Pro plus property-developer breakdowns — by complex, building and unit — and priority support.
“And if the team grows?”
On Pro, nothing happens: users are unlimited there, and fifteen managers cost the same as three. Start has a cap of 10 people: outgrow it and you move to Pro, where the bill again stops depending on headcount.
Yearly — 35% off. 5 currencies: roubles, tenge, lari, dollars, euros; an unknown currency is shown in dollars, not substituted with roubles. Plan limits, the comparison with per-seat billing and what happens after the paid period ends.
base price set in US dollars, other currencies derived from it · web/lib/pricing.ts · the Start user cap — PLAN_LIMITS in web/lib/license-demo.ts · the invoice uses the rate on the payment day
Install it in three steps
It is a link, not an implementation project: no developer and no spec required.
The administrator opens the link and grants access
The widget installs over OAuth. It is revoked in the same place, with one button, and no approval from us is needed.
Result: the widget is in the account, access is read-only, and you can leave at any moment.
The head of sales confirms the stage markup
The heuristic suggests which stages are parking stages. A person decides, not the algorithm: on the full history the heuristic got it wrong. There is no separate screen for the markup yet — you send the list by email, we apply it and recalculate the reports.
Result: parking stages are out of the calculation and conversion follows the sales chain.
First load — 34 minutes
Measured on 7 years of history: 69,567 deals, 1,100,000 events, 240,031 transitions. After that the sync is incremental: 12 seconds every 5 minutes instead of a 250 seconds full pass.
Result: the full history is in the reports and the numbers keep themselves current.
What exactly was measured and how to schedule the load around your telephony — on the installation page.
measured 25.08.2026 · first full load of the pilot account (anonymised property developer account) · docs/РЕШЕНИЯ.md, пункты 37 и 40
Asked on the first call
We answer in writing so the call does not start here.
What do you see in our amoCRM?
Can you break anything in our CRM?
Will a manager see other people’s deals?
Do we need a developer or an implementation project?
When do we see the first numbers?
We have a dozen pipelines and a mess in the stages. Can you handle it?
Half of our fields are empty. Is it useless for us?
What does it cost for a team of fifteen?
Will it work on our amoCRM plan?
How do we disconnect, and what happens to the history?
How do we pay, and do we get closing documents?
Who is it not for?
Open the demo, then install it on your account
The demo runs without sign-up and without access to your CRM: the same nine tabs on anonymised data. The account administrator installs the widget — if that is not you, the installation page builds a ready-made email with the permissions and the first-load time.